


Sunmax Biotechnology Co., Ltd.
4728.TWO- 1D
- +4.6%
Sunmax Biotechnology Co., Ltd. in brief
Sunmax Biotechnology Co., Ltd. is a listed company in the Biotechnology industry, based in Taiwan. Its market value was $657 M on 20 November 2026, which makes it the 11,384th largest listed company in the world and the 313th largest in Taiwan on this site. Its shares trade under the symbol 4728.TWO (Taiwan).
Written from the figures on this page, so it changes when they do. The date of each figure is under How current the figures are.
Sunmax Biotechnology Co., Ltd. timeline
- 2012
- 📈Listed on Taipei Exchange as 4728First day of listing in the exchange's official list.
Events of Sunmax Biotechnology Co., Ltd. from the exchanges' official lists. Dates marked approximate come from statements without a cited source. Spotted a mistake? Use the correction form below.
Sunmax Biotechnology Co., Ltd. share price · Taiwan (4728.TWO)
| Date | Open | High | Low | Close | Change | Volume |
|---|---|---|---|---|---|---|
| Nov 20, 2026 | 374.50 | 396.50 | 356.00 | 396.50 | +4.6% | 36,000 |
| Nov 19, 2026 | 380.00 | 380.00 | 379.00 | 379.00 | -1.4% | 2,000 |
| Nov 16, 2026 | 384.50 | 384.50 | 384.50 | 384.50 | 0.0% | 2,000 |
| Nov 13, 2026 | 383.50 | 385.50 | 383.50 | 384.50 | -0.9% | 9,000 |
| Nov 12, 2026 | 383.00 | 388.00 | 382.00 | 388.00 | 0.0% | 13,000 |
| Nov 10, 2026 | 389.00 | 389.00 | 387.00 | 388.00 | -1.0% | 4,000 |
| Nov 9, 2026 | 392.00 | 392.00 | 392.00 | 392.00 | +0.4% | 13,000 |
| Nov 5, 2026 | 385.00 | 390.50 | 385.00 | 390.50 | +0.4% | 8,000 |
| Nov 4, 2026 | 389.00 | 389.00 | 386.00 | 389.00 | 0.0% | 9,000 |
| Nov 3, 2026 | 390.00 | 400.00 | 389.00 | 389.00 | -1.5% | 28,000 |
| Nov 2, 2026 | 391.50 | 401.00 | 390.00 | 395.00 | +2.1% | 55,000 |
| Oct 30, 2026 | 391.00 | 391.00 | 387.00 | 387.00 | -3.2% | 10,000 |
| Oct 29, 2026 | 402.50 | 402.50 | 400.00 | 400.00 | -0.6% | 11,000 |
| Oct 28, 2026 | 402.50 | 402.50 | 402.50 | 402.50 | -1.6% | 1,000 |
| Oct 27, 2026 | 399.00 | 410.00 | 391.00 | 409.00 | +3.4% | 63,000 |
| Oct 21, 2026 | 393.00 | 395.50 | 393.00 | 395.50 | +0.4% | 3,000 |
| Oct 20, 2026 | 399.00 | 403.00 | 392.00 | 394.00 | -0.3% | 39,000 |
| Oct 16, 2026 | 399.00 | 399.00 | 395.00 | 395.00 | +0.5% | 6,000 |
| Oct 15, 2026 | 391.50 | 393.00 | 391.00 | 393.00 | -1.6% | 4,000 |
| Oct 14, 2026 | 394.50 | 407.00 | 394.00 | 399.50 | +0.9% | 4,000 |
| Oct 13, 2026 | 400.00 | 400.00 | 396.00 | 396.00 | +0.5% | 6,000 |
| Oct 12, 2026 | 400.00 | 407.00 | 394.00 | 394.00 | -0.5% | 60,000 |
| Oct 8, 2026 | 408.00 | 408.00 | 396.00 | 396.00 | +0.4% | 5,000 |
| Oct 7, 2026 | 408.50 | 408.50 | 394.50 | 394.50 | -0.6% | 4,000 |
| Oct 6, 2026 | 395.00 | 399.50 | 394.00 | 397.00 | +0.5% | 12,000 |
| Oct 5, 2026 | 392.00 | 398.00 | 391.50 | 395.00 | +0.1% | 20,000 |
| Oct 2, 2026 | 394.50 | 394.50 | 394.50 | 394.50 | 0.0% | 3,000 |
| Oct 1, 2026 | 397.50 | 397.50 | 394.50 | 394.50 | -1.1% | 14,000 |
| Sep 30, 2026 | 399.00 | 399.00 | 399.00 | 399.00 | -0.1% | 1,000 |
| Sep 29, 2026 | 397.00 | 399.50 | 397.00 | 399.50 | — | 5,000 |
Prices in TWD from the Taipei Exchange; the last 30 trading days are listed, the chart shows up to ten years. For information only; not investment advice.
Sunmax Biotechnology Co., Ltd. share price statistics
Changes compare closing prices; volatility is the annualised standard deviation of daily returns. Prices are as published by the exchange, not adjusted for splits, bonus issues or dividends. For information only; not investment advice.
Market cap history
World rank over time
Rank in Taiwan: #767 (Jan 2020) · #881 (Jan 2022) · #615 (Dec 2022) · #535 (Jul 2023) · #531 (Jan 2024) · #365 (Nov 2026) · #371 (Nov 2026) · #360 (Nov 2026) · #339 (Nov 2026) · #313 (Nov 2026)
Sunmax Biotechnology Co., Ltd. products and services
Search all products and services →Products (3)
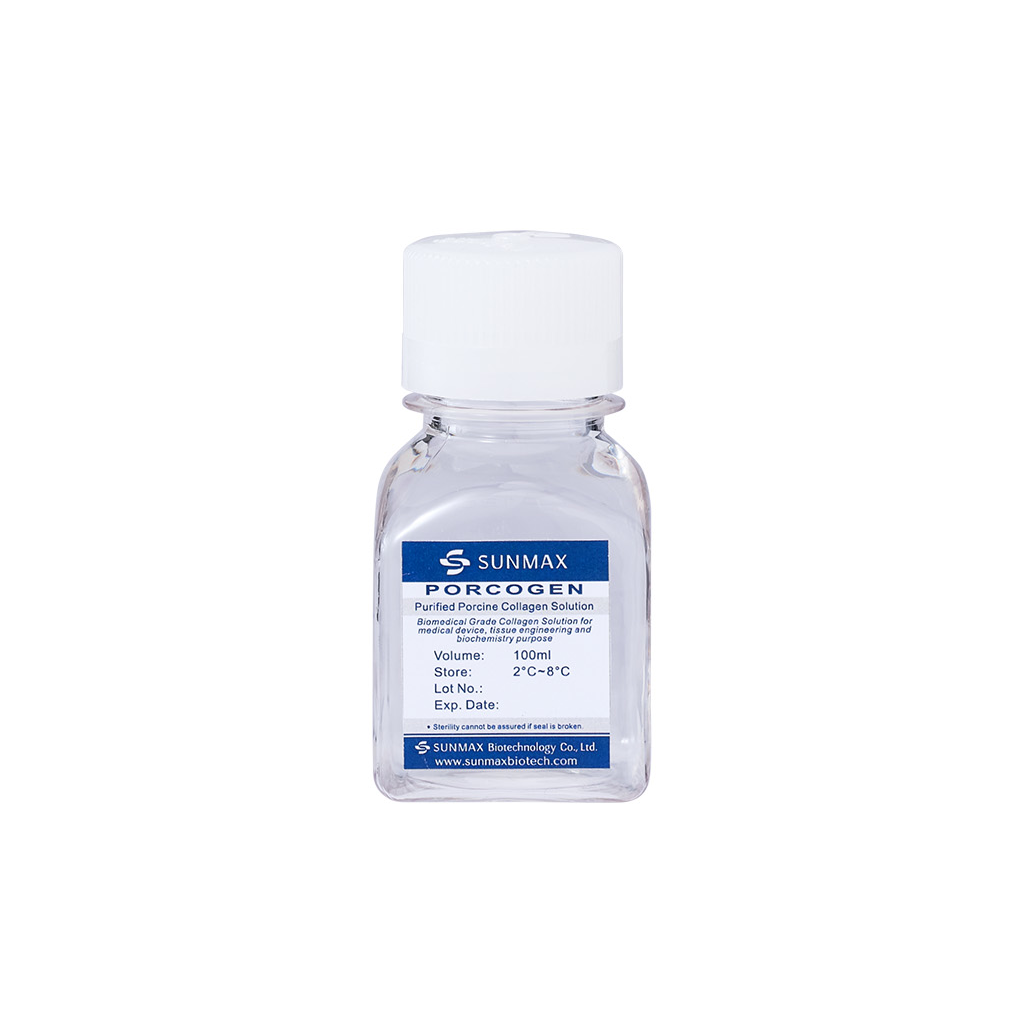
本膠原蛋白溶液由無特定病源豬隻之豬皮所萃取之無菌、高純度膠原蛋白,其成份為分子量約為300KD且具天然三股螺旋結構、性質安定之膠原蛋白分子,純化過程符合GMP之要求。使用方法 :該高純度膠原蛋白溶液可用於醫學研究或組織再造工程,詳細資訊請洽本公司專業人員。保存方式 :本產品需存放2-8℃ (36-46℉)於冷藏環境中,不當的溫度將使膠原蛋白變質,敬請小心留意。建議以無菌操作法來避免污染。

針對醫美療程造成的敏感膚質,還有曬後受損的肌膚所設計的,它含有高純度活性膠原複方成分,對於受傷老化肌膚,能夠快速舒緩、減緩肌膚不適感,讓肌膚維持水嫩狀態,提升肌膚防護能力。

呈現肌膚青春活力感,特別針對乾燥、老化與日曬後的肌膚,量身打造的修護配方,提升肌膚緊緻彈性,同時加強肌膚保濕力,深層補充肌膚流失水分。完整的膠原蛋白,能瞬間增加保水能力及皮膚緊緻度,使膚色重現均勻亮麗、水嫩光滑、更有效強化定妝效果。
Mutual funds holding Sunmax Biotechnology Co., Ltd.#
| Fund | Shares | Value | Of the company | Of the fund | Change in shares | Report |
|---|---|---|---|---|---|---|
| 🇺🇸 Emerging Markets Core Equity 2 PortfolioDimensional Fund Advisors LP | 146,000 | $2 M | — | <0.01% | no change | Jul 31, 2026 |
| 🇺🇸 The Emerging Markets Small Cap SeriesDimensional Fund Advisors LP | 96,000 | $1 M | — | 0.03% | no change | Jul 31, 2026 |
| 🇺🇸 Dimensional Emerging Markets Core Equity 2 ETFDimensional Fund Advisors LP | 26,000 | $0 M | — | <0.01% | no change | Jul 31, 2026 |
| 🇺🇸 State Street SPDR S&P Emerging Markets Small Cap ETFSSGA Funds Management, Inc. | 23,000 | $0 M | — | 0.04% | no change | Jun 30, 2026 |
| 🇺🇸 Dimensional World ex. U.S. Core Equity 2 ETFDimensional Fund Advisors LP | 22,000 | $0 M | — | <0.01% | no change | Jul 31, 2026 |
| 🇺🇸 State Street SPDR Portfolio Emerging Markets ETFSSGA Funds Management, Inc. | 20,000 | $0 M | — | <0.01% | no change | Jun 30, 2026 |
| 🇺🇸 Emerging Markets Social Core Equity PortfolioDimensional Fund Advisors LP | 12,000 | $0 M | — | <0.01% | no change | Jul 31, 2026 |
| 🇺🇸 World ex U.S. Core Equity PortfolioDimensional Fund Advisors LP | 11,000 | $0 M | — | <0.01% | no change | Jul 31, 2026 |
| 🇺🇸 Emerging Markets ex China Core Equity PortfolioDimensional Fund Advisors LP | 8,000 | $0 M | — | <0.01% | no change | Jul 31, 2026 |
| 🇺🇸 Dimensional Emerging Core Equity Market ETFDimensional Fund Advisors LP | 7,000 | $0 M | — | <0.01% | no change | Jul 31, 2026 |
| 🇺🇸 Emerging Markets Sustainability Core 1 PortfolioDimensional Fund Advisors LP | 6,000 | $0 M | — | <0.01% | no change | Jul 31, 2026 |
| 🇺🇸 Avantis Emerging Markets Small Cap Equity ETFAmerican Century ETF Trust | 2,000 | $0 M | — | 0.02% | no change | May 31, 2026 |
| 🇺🇸 Dimensional Emerging Markets Sustainability Core 1 ETFDimensional Fund Advisors LP | 2,000 | $0 M | — | <0.01% | no change | Jul 31, 2026 |
| 🇺🇸 Avantis Emerging Markets ex-China Equity ETFAmerican Century ETF Trust | 1,000 | $0 M | — | <0.01% | no change | May 31, 2026 |
| 🇺🇸 Dimensional Emerging Markets ex China Core Equity ETFDimensional Fund Advisors LP | 1,000 | $0 M | — | <0.01% | no change | Jul 31, 2026 |
| 🇺🇸 FlexShares Morningstar Emerging Markets Factor Tilt Index FundNorthern Trust Investments, Inc. | 1,000 | $0 M | — | <0.01% | no change | Jul 31, 2026 |
As of Jul 31, 2026
Discuss Sunmax Biotechnology Co., Ltd.#
1 automatic updates and 0 member comments. Sign in to comment and react.
- Mutual funds: 16 funds hold $5 millionautomatic update · Jul 31, 2026
16 mutual funds in 1 country hold shares of Sunmax Biotechnology Co., Ltd. worth $5 million (funds' newest reports, up to 31 July 2026).
How Sunmax Biotechnology Co., Ltd. compares in Biotechnology
- Market cap$657 M · higher than 62% of 726
Peer comparison · Biotechnology
| Company | Market cap | P/E | Net margin | Rev. growth |
|---|---|---|---|---|
| Sunmax Biotechnology Co., Ltd.🇹🇼 | $657 M | — | — | — |
| Novo Nordisk A/S🇩🇰 | $203.2 B | 13.1× | 33.1% | +10.8% |
| Vertex Pharmaceuticals Incorporated🇺🇸 | $134.3 B | 33.8× | 30.7% | +8.9% |
| Moderna, Inc.🇺🇸 | $90.1 B | — | -110.5% | -39.9% |
| Regeneron Pharmaceuticals, Inc.🇺🇸 | $84.1 B | 17.5× | 28.5% | +1.0% |
| Argenx SE🇳🇱 | $52.8 B | 40.9× | 31.1% | +89.9% |
| CSL Limited🇦🇺 | $51.6 B | — | -16.4% | — |
| Samsung Biologics Co., Ltd.🇰🇷 | $51.5 B | 40.5× | 39.2% | — |
| UCB SA🇧🇪 | $48.6 B | 26.3× | 20.1% | +31.1% |
P/E and margins use trailing 12-month results where available; growth is the latest fiscal year.
Questions, comparisons and similar companies#
Questions people ask
Compare head to head
Similar companies by size and industry
- Lexicon Pharmaceuticals, Inc.$659 M
- CorMedix Inc.$652 M
- AgomAb Therapeutics NV$651 M
- Aura Biosciences, Inc.$666 M
- Arbutus Biopharma Corporation$644 M
- Autolus Therapeutics$641 M
How current the figures are
- Market cap:
- Nov 20, 2026
- Profile updated:
- Nov 22, 2026
How each figure is collected: data sources and methodology. Market caps in US dollars unless you switch the currency.
Work at Sunmax Biotechnology Co., Ltd.? Verify and update this profile — free
Show Sunmax Biotechnology Co., Ltd.'s ranking on your website Get the badge
The badge updates itself as the ranking changes.